Wireshark的包装说明
Wireshark是世界上最重要的网络协议分析仪。它可以让你看到发生了什么在网络上,在微观层面。这是在许多行业和教育机构事实上(往往在法律上)的标准。 Wireshark的开发蓬勃发展得益于世界各地的网络专家的贡献。它是在1998年开始的一个项目的延续。
Wireshark的具有丰富的功能集,包括以下内容:
- 深检查数百个协议的,更多的被加入所有的时间
- 现场捕获和离线分析
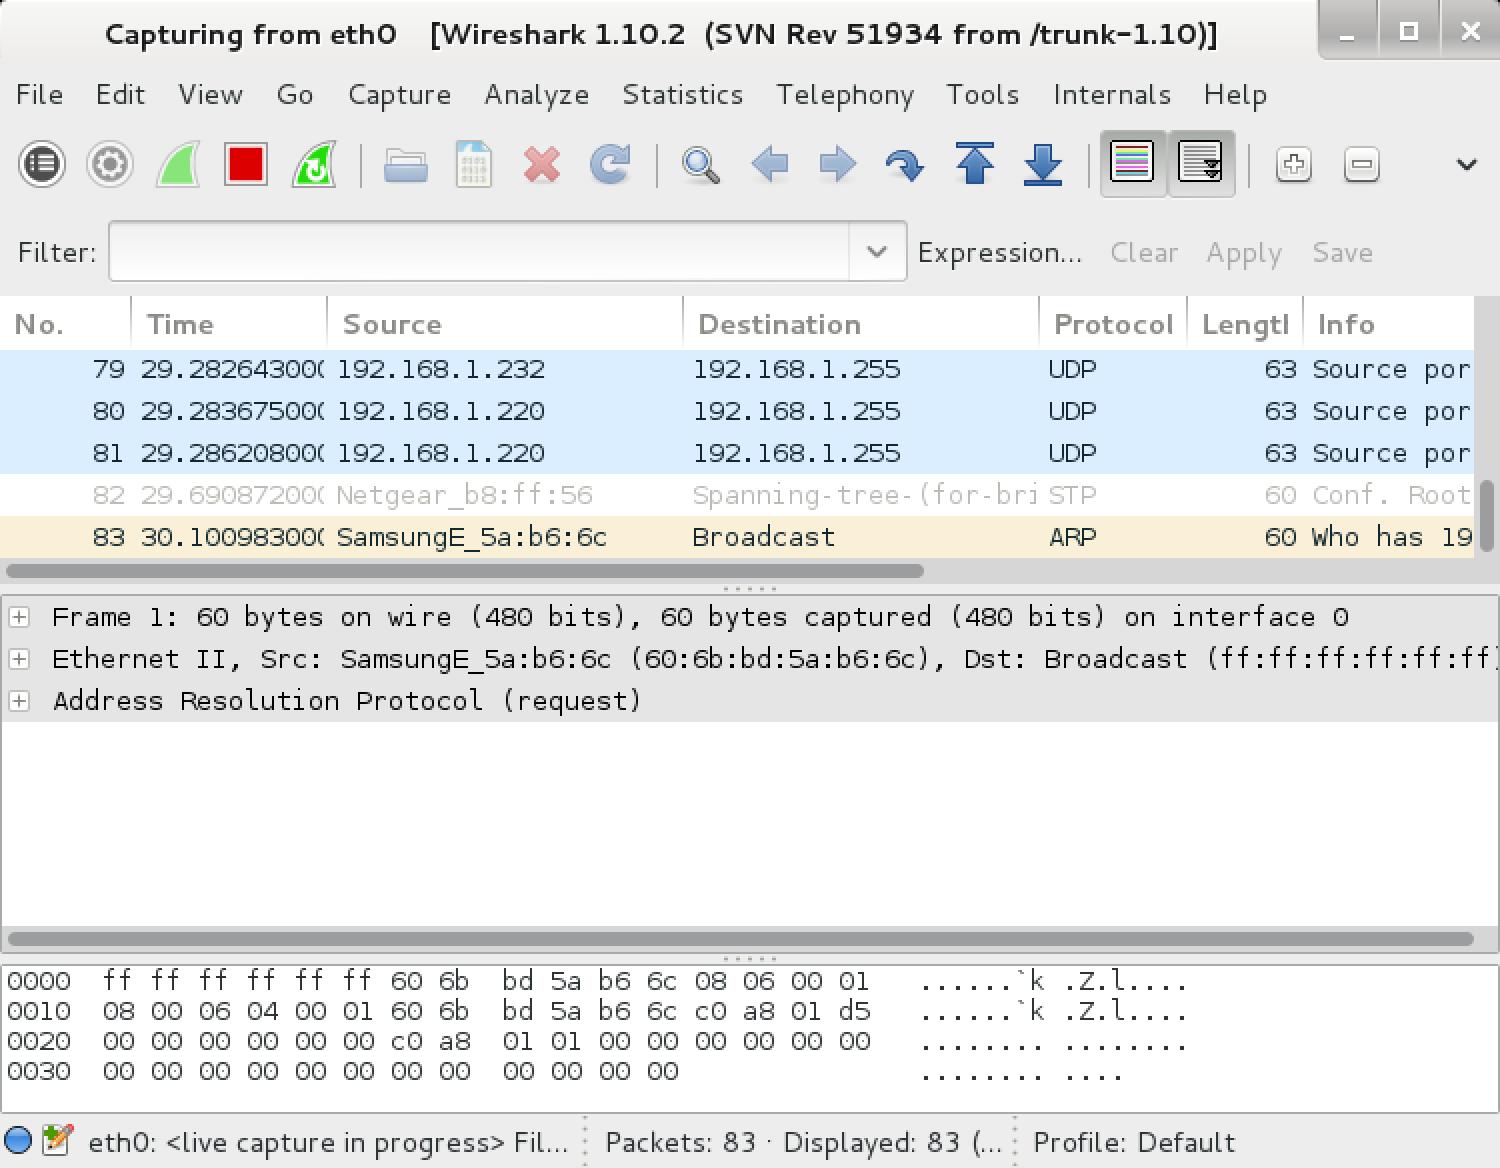
- 标准三个窗格包浏览器
- 多平台:运行在Windows,Linux,OS X,Solaris和FreeBSD的,NetBSD的,和许多其他
- 捕获的网络数据可以经由GUI进行浏览,或者通过TTY模式tshark的效用
- 在同行业中最强大的显示过滤器
- 丰富的VoIP分析
- 用gzip压缩捕获文件可以在飞行中进行解压
- 实时数据可从以太网,IEEE 802.11,PPP / HDLC,ATM,蓝牙,USB,令牌环网,帧中继,FDDI,和其他人阅读(根据您的平台)
- 着色规则可以应用于分组列表为快速,直观的分析
- 输出可以导出到XML,的PostScript®,CSV,或纯文本
- 对于很多协议,包括IPSec,ISAKMP,Kerberos的,的SNMPv3,SSL / TLS,WEP和WPA / WPA2解密支持
- 读/写很多不同的捕获文件格式:tcpdump的库(libpcap),PCAP NG,凯达普DCT2000,Cisco安全IDS iplog,Microsoft网络监视器,网络*一般Sniffer®(压缩和非压缩),Sniffer®Pro和NetXray®,网络工具观察外,NetScreen窥探,Novell公司LANalyzer,RADCOM WAN / LAN分析仪,Shomiti / Finisar公司测量师,泰克K12xx,视觉网视觉正常运行时间,WildPackets的EtherPeek能/ TokenPeek / AiroPeek的,和其他许多人
资料来源:http://www.wireshark.org/about.html
Wireshark的首页 | 卡利Wireshark的回购
- 作者:杰拉尔德梳子和贡献者
- 许可:GPL第二版
包含在Wireshark的包工具
wireshark – network traffic analyzer – GTK+ version
[email protected]:~# wireshark -h
Wireshark 1.10.2 (SVN Rev 51934 from /trunk-1.10)
Interactively dump and analyze network traffic.
See http://www.wireshark.org for more information.
Copyright 1998-2013 Gerald Combs <[email protected]> and contributors.
This is free software; see the source for copying conditions. There is NO
warranty; not even for MERCHANTABILITY or FITNESS FOR A PARTICULAR PURPOSE.
Usage: wireshark [options] ... [ <infile> ]
Capture interface:
-i <interface> name or idx of interface (def: first non-loopback)
-f <capture filter> packet filter in libpcap filter syntax
-s <snaplen> packet snapshot length (def: 65535)
-p don't capture in promiscuous mode
-k start capturing immediately (def: do nothing)
-S update packet display when new packets are captured
-l turn on automatic scrolling while -S is in use
-I capture in monitor mode, if available
-B <buffer size> size of kernel buffer (def: 2MB)
-y <link type> link layer type (def: first appropriate)
-D print list of interfaces and exit
-L print list of link-layer types of iface and exit
Capture stop conditions:
-c <packet count> stop after n packets (def: infinite)
-a <autostop cond.> ... duration:NUM - stop after NUM seconds
filesize:NUM - stop this file after NUM KB
files:NUM - stop after NUM files
Capture output:
-b <ringbuffer opt.> ... duration:NUM - switch to next file after NUM secs
filesize:NUM - switch to next file after NUM KB
files:NUM - ringbuffer: replace after NUM files
Input file:
-r <infile> set the filename to read from (no pipes or stdin!)
Processing:
-R <read filter> packet filter in Wireshark display filter syntax
-n disable all name resolutions (def: all enabled)
-N <name resolve flags> enable specific name resolution(s): "mntC"
User interface:
-C <config profile> start with specified configuration profile
-Y <display filter> start with the given display filter
-g <packet number> go to specified packet number after "-r"
-J <jump filter> jump to the first packet matching the (display)
filter
-j search backwards for a matching packet after "-J"
-m <font> set the font name used for most text
-t a|ad|d|dd|e|r|u|ud output format of time stamps (def: r: rel. to first)
-u s|hms output format of seconds (def: s: seconds)
-X <key>:<value> eXtension options, see man page for details
-z <statistics> show various statistics, see man page for details
Output:
-w <outfile|-> set the output filename (or '-' for stdout)
Miscellaneous:
-h display this help and exit
-v display version info and exit
-P <key>:<path> persconf:path - personal configuration files
persdata:path - personal data files
-o <name>:<value> ... override preference or recent setting
-K <keytab> keytab file to use for kerberos decryption
--display=DISPLAY X display to use
tshark – network traffic analyzer – console version
[email protected]:~# tshark -h
TShark 1.10.2 (SVN Rev 51934 from /trunk-1.10)
Dump and analyze network traffic.
See http://www.wireshark.org for more information.
Copyright 1998-2013 Gerald Combs <[email protected]> and contributors.
This is free software; see the source for copying conditions. There is NO
warranty; not even for MERCHANTABILITY or FITNESS FOR A PARTICULAR PURPOSE.
Usage: tshark [options] ...
Capture interface:
-i <interface> name or idx of interface (def: first non-loopback)
-f <capture filter> packet filter in libpcap filter syntax
-s <snaplen> packet snapshot length (def: 65535)
-p don't capture in promiscuous mode
-I capture in monitor mode, if available
-B <buffer size> size of kernel buffer (def: 2MB)
-y <link type> link layer type (def: first appropriate)
-D print list of interfaces and exit
-L print list of link-layer types of iface and exit
Capture stop conditions:
-c <packet count> stop after n packets (def: infinite)
-a <autostop cond.> ... duration:NUM - stop after NUM seconds
filesize:NUM - stop this file after NUM KB
files:NUM - stop after NUM files
Capture output:
-b <ringbuffer opt.> ... duration:NUM - switch to next file after NUM secs
filesize:NUM - switch to next file after NUM KB
files:NUM - ringbuffer: replace after NUM files
Input file:
-r <infile> set the filename to read from (no pipes or stdin!)
Processing:
-2 perform a two-pass analysis
-R <read filter> packet Read filter in Wireshark display filter syntax
-Y <display filter> packet displaY filter in Wireshark display filter syntax
-n disable all name resolutions (def: all enabled)
-N <name resolve flags> enable specific name resolution(s): "mntC"
-d <layer_type>==<selector>,<decode_as_protocol> ...
"Decode As", see the man page for details
Example: tcp.port==8888,http
-H <hosts file> read a list of entries from a hosts file, which will
then be written to a capture file. (Implies -W n)
Output:
-w <outfile|-> write packets to a pcap-format file named "outfile"
(or to the standard output for "-")
-C <config profile> start with specified configuration profile
-F <output file type> set the output file type, default is pcapng
an empty "-F" option will list the file types
-V add output of packet tree (Packet Details)
-O <protocols> Only show packet details of these protocols, comma
separated
-P print packet summary even when writing to a file
-S <separator> the line separator to print between packets
-x add output of hex and ASCII dump (Packet Bytes)
-T pdml|ps|psml|text|fields
format of text output (def: text)
-e <field> field to print if -Tfields selected (e.g. tcp.port, col.Info);
this option can be repeated to print multiple fields
-E<fieldsoption>=<value> set options for output when -Tfields selected:
header=y|n switch headers on and off
separator=/t|/s|<char> select tab, space, printable character as separator
occurrence=f|l|a print first, last or all occurrences of each field
aggregator=,|/s|<char> select comma, space, printable character as
aggregator
quote=d|s|n select double, single, no quotes for values
-t a|ad|d|dd|e|r|u|ud output format of time stamps (def: r: rel. to first)
-u s|hms output format of seconds (def: s: seconds)
-l flush standard output after each packet
-q be more quiet on stdout (e.g. when using statistics)
-Q only log true errors to stderr (quieter than -q)
-g enable group read access on the output file(s)
-W n Save extra information in the file, if supported.
n = write network address resolution information
-X <key>:<value> eXtension options, see the man page for details
-z <statistics> various statistics, see the man page for details
Miscellaneous:
-h display this help and exit
-v display version info and exit
-o <name>:<value> ... override preference setting
-K <keytab> keytab file to use for kerberos decryption
-G [report] dump one of several available reports and exit
default report="fields"
use "-G ?" for more help
tshark Usage Example
[email protected]:~# tshark -f "tcp port 80" -i eth0
wireshark Usage Example
[email protected]:~# wireshark
Wireshark 1.10.2 (SVN Rev 51934 from /trunk-1.10)
Interactively dump and analyze network traffic.
See http://www.wireshark.org for more information.
Copyright 1998-2013 Gerald Combs <[email protected]> and contributors.
This is free software; see the source for copying conditions. There is NO
warranty; not even for MERCHANTABILITY or FITNESS FOR A PARTICULAR PURPOSE.
Usage: wireshark [options] ... [ <infile> ]
Capture interface:
-i <interface> name or idx of interface (def: first non-loopback)
-f <capture filter> packet filter in libpcap filter syntax
-s <snaplen> packet snapshot length (def: 65535)
-p don't capture in promiscuous mode
-k start capturing immediately (def: do nothing)
-S update packet display when new packets are captured
-l turn on automatic scrolling while -S is in use
-I capture in monitor mode, if available
-B <buffer size> size of kernel buffer (def: 2MB)
-y <link type> link layer type (def: first appropriate)
-D print list of interfaces and exit
-L print list of link-layer types of iface and exit
Capture stop conditions:
-c <packet count> stop after n packets (def: infinite)
-a <autostop cond.> ... duration:NUM - stop after NUM seconds
filesize:NUM - stop this file after NUM KB
files:NUM - stop after NUM files
Capture output:
-b <ringbuffer opt.> ... duration:NUM - switch to next file after NUM secs
filesize:NUM - switch to next file after NUM KB
files:NUM - ringbuffer: replace after NUM files
Input file:
-r <infile> set the filename to read from (no pipes or stdin!)
Processing:
-R <read filter> packet filter in Wireshark display filter syntax
-n disable all name resolutions (def: all enabled)
-N <name resolve flags> enable specific name resolution(s): "mntC"
User interface:
-C <config profile> start with specified configuration profile
-Y <display filter> start with the given display filter
-g <packet number> go to specified packet number after "-r"
-J <jump filter> jump to the first packet matching the (display)
filter
-j search backwards for a matching packet after "-J"
-m <font> set the font name used for most text
-t a|ad|d|dd|e|r|u|ud output format of time stamps (def: r: rel. to first)
-u s|hms output format of seconds (def: s: seconds)
-X <key>:<value> eXtension options, see man page for details
-z <statistics> show various statistics, see man page for details
Output:
-w <outfile|-> set the output filename (or '-' for stdout)
Miscellaneous:
-h display this help and exit
-v display version info and exit
-P <key>:<path> persconf:path - personal configuration files
persdata:path - personal data files
-o <name>:<value> ... override preference or recent setting
-K <keytab> keytab file to use for kerberos decryption
--display=DISPLAY X display to use
TShark 1.10.2 (SVN Rev 51934 from /trunk-1.10)
Dump and analyze network traffic.
See http://www.wireshark.org for more information.
Copyright 1998-2013 Gerald Combs <[email protected]> and contributors.
This is free software; see the source for copying conditions. There is NO
warranty; not even for MERCHANTABILITY or FITNESS FOR A PARTICULAR PURPOSE.
Usage: tshark [options] ...
Capture interface:
-i <interface> name or idx of interface (def: first non-loopback)
-f <capture filter> packet filter in libpcap filter syntax
-s <snaplen> packet snapshot length (def: 65535)
-p don't capture in promiscuous mode
-I capture in monitor mode, if available
-B <buffer size> size of kernel buffer (def: 2MB)
-y <link type> link layer type (def: first appropriate)
-D print list of interfaces and exit
-L print list of link-layer types of iface and exit
Capture stop conditions:
-c <packet count> stop after n packets (def: infinite)
-a <autostop cond.> ... duration:NUM - stop after NUM seconds
filesize:NUM - stop this file after NUM KB
files:NUM - stop after NUM files
Capture output:
-b <ringbuffer opt.> ... duration:NUM - switch to next file after NUM secs
filesize:NUM - switch to next file after NUM KB
files:NUM - ringbuffer: replace after NUM files
Input file:
-r <infile> set the filename to read from (no pipes or stdin!)
Processing:
-2 perform a two-pass analysis
-R <read filter> packet Read filter in Wireshark display filter syntax
-Y <display filter> packet displaY filter in Wireshark display filter syntax
-n disable all name resolutions (def: all enabled)
-N <name resolve flags> enable specific name resolution(s): "mntC"
-d <layer_type>==<selector>,<decode_as_protocol> ...
"Decode As", see the man page for details
Example: tcp.port==8888,http
-H <hosts file> read a list of entries from a hosts file, which will
then be written to a capture file. (Implies -W n)
Output:
-w <outfile|-> write packets to a pcap-format file named "outfile"
(or to the standard output for "-")
-C <config profile> start with specified configuration profile
-F <output file type> set the output file type, default is pcapng
an empty "-F" option will list the file types
-V add output of packet tree (Packet Details)
-O <protocols> Only show packet details of these protocols, comma
separated
-P print packet summary even when writing to a file
-S <separator> the line separator to print between packets
-x add output of hex and ASCII dump (Packet Bytes)
-T pdml|ps|psml|text|fields
format of text output (def: text)
-e <field> field to print if -Tfields selected (e.g. tcp.port, col.Info);
this option can be repeated to print multiple fields
-E<fieldsoption>=<value> set options for output when -Tfields selected:
header=y|n switch headers on and off
separator=/t|/s|<char> select tab, space, printable character as separator
occurrence=f|l|a print first, last or all occurrences of each field
aggregator=,|/s|<char> select comma, space, printable character as
aggregator
quote=d|s|n select double, single, no quotes for values
-t a|ad|d|dd|e|r|u|ud output format of time stamps (def: r: rel. to first)
-u s|hms output format of seconds (def: s: seconds)
-l flush standard output after each packet
-q be more quiet on stdout (e.g. when using statistics)
-Q only log true errors to stderr (quieter than -q)
-g enable group read access on the output file(s)
-W n Save extra information in the file, if supported.
n = write network address resolution information
-X <key>:<value> eXtension options, see the man page for details
-z <statistics> various statistics, see the man page for details
Miscellaneous:
-h display this help and exit
-v display version info and exit
-o <name>:<value> ... override preference setting
-K <keytab> keytab file to use for kerberos decryption
-G [report] dump one of several available reports and exit
default report="fields"
use "-G ?" for more help